Moriarty
Insights Officer
Best-in-Class GA4 Insight Dashboard
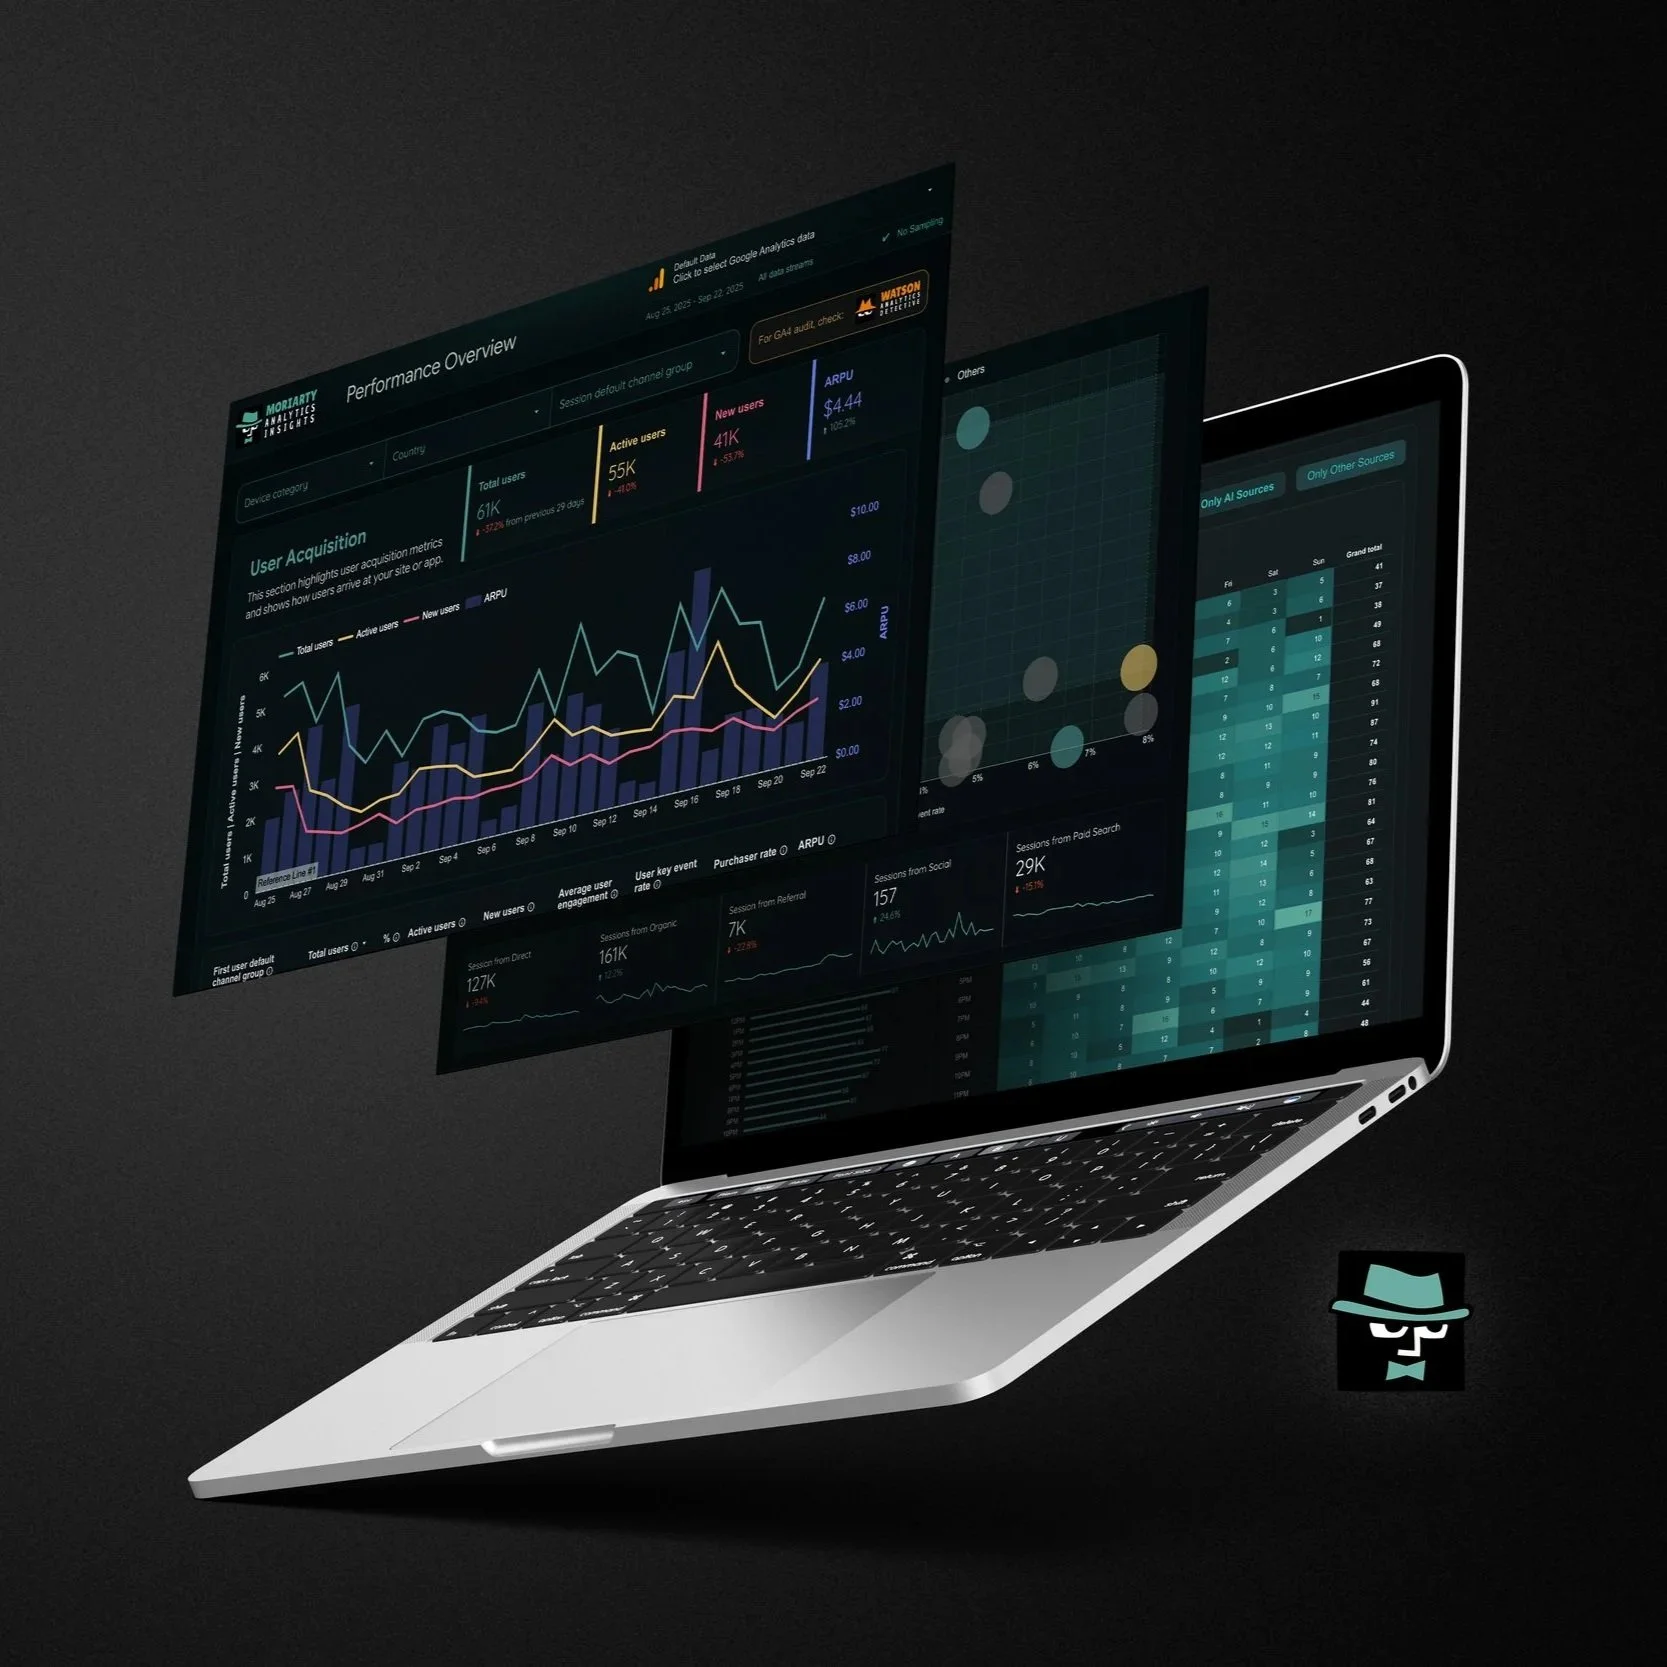
Moriarty surfaces hidden insights from the data you’ve already collected in your GA4 property!
Free Looker Studio Report
60+ Reports (And Growing!)
Use Moriarty for free:
Moriarty dives deep into your GA4 data to transform and organize your scattered GA4 data into easy to understand, focused insights you can act on, without touching tracking, code, or BigQuery.
Frequently Asked Questions
Hire Moriarty →
How do I use Moriarty with my GA4 property?
Simply open the Looker Studio report, use the data control to select your GA4 property, and review the overview page before drilling into the sections you need.
What does Moriarty do, exactly?
It organizes what you already collect in GA4 into 60+ focused views (acquisition, audience, engagement, conversions, e-commerce, content, trends, time-of-day/weekday) so you can see what’s working, what’s slipping, and where to look next.
Is it really free?
Yes. Moriarty is free to use. If you want audit checks or continuous detection, pair it with Watson (free) and Sherlock (on-premises).
How is Moriarty different from Watson and Sherlock?
Moriarty reports and presents insights. Watson audits for tracking/data-quality issues. Sherlock continuously detects unknown-unknowns in your GA4 data in BigQuery with alerts. Use Moriarty for weekly reviews when you need insight and stakeholder visibility; use Watson and Sherlock when you need data quality monitoring and detection of issues.
Can I use it across multiple GA4 properties?
Yes. The data control lets you switch between all GA4 properties that you have access to.
Is Moriarty secure?
Yes. The data control only lists GA4 properties the current viewer is authorized to see. We can neither see your properties nor your data. Access follows Looker Studio and GA4 permissions. For more information, please refer to this official documentation page.
Can I white-label the Moriarty?
Yes. You can purchase a copy and customize branding, colors, logos, and pages. You can also duplicate pages, add/remove charts, change filters and date ranges, and add your own calculated fields. Keep the structure; adapt the views to your team or your clients.
Does Moriarty require BigQuery?
No. It reads your GA4 data via Looker Studio. BigQuery is not required.
I’m getting quota error on some charts, what should I do?
Please refresh the report or come back later. Depending on how may times a specific GA4 property is getting accessed via GA4 API per day, per hour, or simultaneously, it might hit one of the GA4 API quota limits. For more information, please refer this official documentation page on GA4 API Quotas.
How fresh is the data?
It reflects whatever GA4 has processed. Some metrics appear quickly; others have processing delays. Moriarty doesn’t add delay or caching on top.
Does Moriarty change my data or tracking?
No. It’s read-only reporting. It does not modify GA4 settings or send events.
Some charts show no data. Why?
Most often: date range, filters, or permissions. Check the selected property, verify you have access, clear filters, and confirm the GA4 property is collecting the relevant events. If you suspect there’s a bug, feel free to contact us at moriarty at siavak.com.
Does Moriarty include AI/bot traffic reports?
It includes dedicated AI traffic views using standard GA4 signals. It does not classify bots; use Sherlock for ML-based bot detection.
What if I encounter errors or issues in my audit report?
Please use the Suggestion Box available on the dashboard to report any issues or errors. We’re here to help resolve them quickly and improve your experience.
Can I suggest new views or reports for Moriarty?
Absolutely! Your input is valuable. Simply share your suggestions here. We’re constantly improving the detectives based on user feedback.
Moriarty’s GA4 Reports Handbook
Hire Moriarty →
What’s inside (high level)
Traffic Acquisition
Channels, sources, mediums; paid vs. organic; referral and direct.
AI Traffic Reports
In-depth views for AI traffic sources and sessions.
User Acquisition
New vs. returning users & cohorts.
Audience Profiles
Demographics, tech, geography.
Retention & Engagement
Stickiness, session depth, frequency.
Conversion Insights
Funnels, assisted paths, drop-offs.
E-commerce Performance
Revenue, products, carts, checkout flow.
Content Performance
Landing pages, on-site search terms.
Trending Categories
Top rising and falling segments.
Time-based Analysis
By hour and weekday to spot seasonality.


